新手上路
四星級會員
- 舊站積分
- 793
- 舊站發表文章數
- 2157
|
 發表於 2010-5-6 00:13:42
|
顯示全部樓層
REW終於發佈新版本了
http://www.hometheatershack.com/ ... -beta-feedback.html
更新內容如下
Beta build updates
5.5.2010:
Update soundcard settings sweep level when changed from measurement dialog
Don't mark data as needing to be saved when generating waterfalls, decay or spectrograms
Fixed incorrect "data not saved" warnings on exit or deleting measurements and changed warning text
Stopped waterfall graphs drawing outside bounds
Made provision for MODAL filter type in routines that send filters to TMREQ, BFD, FBQ
IR Windows frame was not closed if all measurements had been deleted
Measurement panel help was not updated
Measurement description could be set to blank
Use a common color chooser for all color selection buttons
Waterfall apply Defaults button did not restore perspective selection settings properly
Fixed possible bug in programmatic equaliser selection
Cal max increased to 180dB(!)
Abbreviated text for Parametric EQ filter in filter panel filter type selector could be incorrect sometimes
File dialog preview would crash if a measurement file had more than 9 measurements
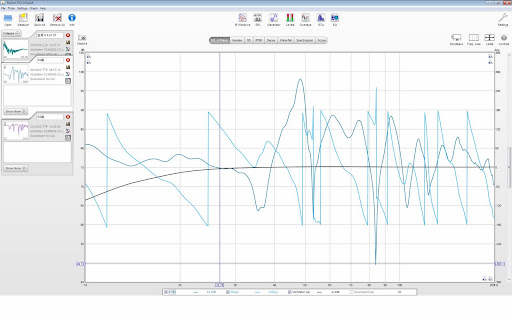
New Features/Changes in V5
New user interface
Separate Overlay, RTA and EQ windows
Increased max measurements to 20
Added an "SPL & Phase" graph group to show magnitude and phase of current tab with controls to unwrap the phase, convert the impulse response to minimum phase
Added button to estimate the IR delay (by cross correlation with a minimum phase converted version of the IR)
Added a " hase" graph group to show the phase response of measurements
Added a "Group Delay" graph group to show the group delay of measurements
With the addition of the phase & group delay plots absolute time becomes important, so a left channel loopback can be used as a timing reference (selected via the Analysis Settings), the old use of "left as cal ref" has been removed as has the "System Delay" from the info panel, no longer valid with left as timing ref.
Added a step response plot to the impulse graph group and a step responses overlay graph group
Added spectrogram display
Waterfall and spectral decay minimum window widths reduced to 1ms (from 50ms), min waterfall range reduced to 10ms (from 200ms)
Waterfall maximum window width increased to 1500ms, maximum time range increased to 1500ms
Decay maximum window width increased to 1500ms
Waterfall time range and window settings remembered for next startup
Waterfall automatically updated if window or time range are changed
Button added to restore default waterfall settings
Decay time step and window settings remembered for next startup
Decay automatically updated if window or time step are changed
Button added to restore default decay settings
Assigned shortcut keys to the graph corner buttons (Alt+G for Generate etc)
Frequency responses are converted to logarithmically spaced data at 96 points per octave if this uses less memory than linearly spaced data, provided the associated check box is selected in the Analysis settings (it is selected by default)
Changed RTA averaging to offer exponential with varying filter factor and a "Forever" linear average
Modified the check levels routine on the measurement panel to use subcal for sweep end <= 300Hz, spkrcal for sweep that includes 500..2000Hz or a custom pink that spans the sweep range otherwise
Changed ETC y axis default to percent
File previewer shows delta frequency and data length for MLSSA .frq files
MLSSA .frq exports limited to 32k samples
Text exports of measurements are limited to 65,530 rows so data can be pasted into spreadsheets with 64k row limits
Small changes to the format of the IR exported as text to allow easier parsing of the file
Changed default freq axis setting for waterfall and spectral decay plots to logarithmic
Added option in Save Graph As JPEG dialog to include the graph legend
Graph JPEGs optionally include the title of the graph and show whether smoothing has been applied
Added option in Save Graph As JPEG dialog to include a line of text to appear under the title
Added a Cancel button to the exit warning dialog which appears if there are unsaved measurements
Made the y axis grid steps independent for each Y axis type
When saving a measurement the filename defaults to the measurement name
Graph cursor shows level as well as frequency
Automatic trace highlighting when the mouse cursor is placed over the trace legend name. This changes the trace plotting order so that the highlighted trace is drawn last, on top of all others, and with a translucent background to help it stand out. Particularly useful for overlay plots.
Label the fundamental with "1" when showing distortion harmonics on the RTA plot, draw labels on translucent background
The IR start time can be offset by a specified time as well as a specified number of samples
Added Alt+Up Arrow and Alt+Down Arrow shortcuts to select the previous or next measurement respectively
Mic/meter and soundcard calibrations accept phase as well as SPL corrections
Soundcard calibration procedure generates phase as well as SPL corrections
The individual data points in the stimulus, captured and impulse traces are shown when the trace is zoomed in sufficiently (this can be turned on/off via the trace controls panel in each case)
Added an Analysis setting to select between setting the zero time for the impulse response at the peak of the impulse or at the first point the response goes above 1% of peak energy (10% of peak level)
Added support for impulse response import from AIFF files
FR thumbnail is updated when smoothing is changed
Mic/Meter and Soundcard cal data are held within the mdat file
Mic/Meter and Soundcard cal filenames are shown on the measurement panel
Mic/Meter and Soundcard cal full file paths are shown in the Info Panel
If, when a measurement which does not contain cal data is loaded, the cal files it used match the current default cal files they are automatically copied into the measurement
Added 1/6 octave smoothing shortcut ctrl+shift+6
Allow semicolon as value separator in imported data
Added cut/copy/paste popup menu for measurement notes area
Changed default interpolation for house curves to logarithmic
Impulse Response import from .wav/.aiff/.pcm takes first 256k samples (was 128k)
Increased font size for help text by 1 point
SPL meter cal allows cal ref values up to 150dB (previous 100dB limit too low in some cases)
EQ Features
Separate EQ window with split screen graph display, the top graph is like the old Filter Adjust graph, while below that there are plots of either the waterfall for the measurement or the impulse response. The divider between the upper and lower plots can be moved by dragging it.
In the Filter Tasks pane there is a "Match filters to Target" that uses some new algorithms to assign EQ filters to bring the measured response onto the target response (as selected/adjusted from the Target pane)
The Predicted results of EQ can be seen on the waterfall and impulse response displays with optional live update as filter settings are changed
Predicted results are generated by applying filters directly to the measurement impulse response
There is a new Modal (MO) filter type to help targeting modal resonances, it is a convenience for configuring a PK filter to match a specific mode decay time. To match any particular mode RT60 time the filter bandwidth needs to be adjusted whenever the filter gain is changed, when the "MO" type is selected and the required RT60 time dialled up REW will control the bandwidth to match the gain you select, and alter the bandwidth if you adjust the gain.
Added options to fill the filter responses, show individual filter responses and fill the individual responses on the filter Adjust graph page
EQ controls accelerate when arrow buttons held down
Added a "redicted Phase" overlay group
Took filter sort key and direction selection out of Equaliser settings and put them on filters panel, added bandwidth and area sort keys
To change the currently selected measurement from the EQ panel (or anywhere else) use Alt+the number of the measurement, e.g. Alt+1 to select the first measurement
Bug fixes
Waterfall and decay plots were sometimes drawn incorrectly when frequency axis was linear
Using left as ref caused boosting of LF noise
Changing EQ type did not realign internal filter settings to match ranges and resolutions of newly selected EQ
Start time of captured data trace on scope plot was at -1s when not using left channel as ref
Trace graph label was not immediately updated when measurement name was changed
Rounding errors could accumulate when full range measurements were exported as text giving incorrect frequencies at the end of the file
Data import failed on data using comma as decimal separator
Values in MLSSA .frq exports were dB SPL, changed to linear magnitude
Adding trace offset to data when trace was smoothed would result in the offset being lost when smoothing was changed
Check box for regression line on impulse response page is only enabled when y axis is dB FS
ETC smoothing spinner on impulse controls page was not updated when changing between measurements
Corrected direction of y axis scroll bar
Mic/Meter cal file trace is active if "C weighted SPL meter" is selected
Corrected part number and image for Radio Shack 1/8" to RCA Y adaptor cable in help
When smoothing is applied to a measurement the Predicted trace now correctly shows the effect of smoothing the filtered measurement
The Predicted trace now correctly shows the effect of IR windowing the filtered measurement
The RTA graph showed dB values for the current saved measurement even when the axis was set to dB FS
Soundcard level at 1kHz could be reported incorrectly in soundcard measurement
Added filename validation to restrict saved filenames to alphanumeric, -, . and _ characters as certain illegal characters (e.g. ":") could cause internal errors
Minimum displayed frequency would not reduce to reflect correct minimum for IR window width
Peak sample in filter or impulse responses exported as WAV could be inverted
Read more: REW V5 Beta feedback - Home Theater Forum and Systems - HomeTheaterShack.com |
|

 樓主: Ken Wu

 ] [/B]
 ]

 ]